 Credit Groups
  Client Login
 By introducing proven order-to-cash (O2C) tools and prioritizing high-balance accounts, a company awash in overdue accounts is now flush with cash.
With over half of their receivables stuck in the 90+ day aging bucket, this client faced serious revenue losses and a growing backlog of unpaid invoices. To fix it, they partnered with Cadex to overhaul their accounts receivable (AR) process using automation, reliable tools, and a dedicated team—unlocking faster cash flow.
As a provider of portable sanitation for events, projects, and emergencies, they needed a partner that could streamline operations and scale fast. With stronger invoicing and payment follow-up, they’ve improved customer relationships (B2B and B2C), boosted investor returns, and positioned themselves for continued growth across the U.S.
Building a Liquid and
Solid Business
ABOUT THIS CLIENT
Founded in 1999 in Massachusetts, this privately held company has 4,000+ employees and 140+ locations nationwide. A billion-dollar leader in event, industrial, construction, and government site services, they provide portable restrooms, washing stations, temporary fencing, power, and waste disposal solutions across the U.S.
ENGAGEMENT SUMMARY
Contract Start Date: 2022
Industry: Industrial Equipment Leasing & Rental
Resources Assigned: 70 FTEs from USA, Romania,
Colombia, India
SERVICES APPLIED
- AR Management
- First-party (1P) Collections
- Third-party (3P) Collections
- Dispute Management
- Credit Management
The Challenges
A lack of cash flow was affecting revenue and growth.
Late and unpaid invoices have detrimental impacts if left unchecked. They reduce capacity for inventory improvements, affect customer relationships, and make it challenging to pay employees, lenders, and partners. For this particular client, ballooning AR also made it challenging to meet expansion goals and impeded ramp-up capabilities for community special events, projects, and emergency response (fires, hurricanes, earthquakes, etc.).
In the porta-potty rental business, one unit typically serves 50 people for a four-hour event, with rentals averaging about one month. Each unit generates $100–$200 per day, providing essential sanitation for outdoor events and construction sites. As demonstrated during the pandemic, this company delivers a critical service.
When a new CFO joined in 2019, he quickly identified major issues:
- A high volume of aged accounts
- Unreliable and outdated customer contact data
- Confusing and inconsistent pricing/billing
- Ineffective dispute resolution processes
- Limited internal resources for scaling timely deliveries
With health, safety, and compliance as core values, unresolved AR was restricting the company’s ability to support its customers' projects and events. Frequent acquisitions added complexity, bringing in new customer records from multiple systems.
They needed expert AR support—so they partnered with Cadex.

Don’t Waste Another Moment Wondering If a Customer Will Pay
 CONTINUE READING
 The Solution
With a mix of people, process, and AR technology enhancements, Cadex maximized AR recovery.
The company had over 150,000 customers and a high ratio of aged accounts. To regain control, they outsourced accounts receivable (1P and 3P collections), dispute management, and credit management to Cadex, placing 40,000+ customer receivables, totaling $125M, under our care.
For this first-time outsourcer, Cadex implemented a comprehensive 1P collections strategy.
By methodically resolving AR inefficiencies, Cadex reduced the client’s ongoing reliance on external support.
Today, only portfolio clean-ups, automation refinements, and occasional 3P collections are required.
Full-Service Team
High-balance, high-priority B2B accounts were assigned dedicated specialists for dispute resolution and cross-functional support.
Express Service Team
A high-volume team handled smaller balance B2C accounts efficiently.
Process Automation
Automated dispute resolution and escalation workflows improved consistency and efficiency.
Autopay Support
As the client introduced autopay to improve cash recovery, Cadex facilitated adoption and customer transitions.
Custom Reporting
New account- and inventory-focused reports enhanced strategic decision-making.
A/R Software Suite
Cadex’s collection tools streamlined operations, including:
- Automated voicemail distribution
- Pre-programmed email reminders and notices
- Outbound auto-dialing to improve customer contact rates
The Results
Of the customers placed with Cadex, two-thirds had outstanding balances that were more than 30 days past due. The team immediately started reaching out to these customers at least once per week, and these tactics not only strengthened relationships with customers, but also helped the client achieve its EOY cash goal.

Average AR
Overdues
Why Cadex?

Better Guidance
Better Tools
Better Reach


I assist troubled companies that have poor credit policies and are trying to improve their accounts receivable. In 30 years of doing so, I frequently encounter stressed out credit managers. The credit manager is taking heat for the companies’ cash flow troubles. All to often, the credit manager was trying to shine a light on larger issues that negatively affect accounts receivable performance. Here are the key things that can help you and your company improve its credit policies and avoid the serious cash flow issues that result from a poor accounts receivable aging.
Know Who Uses the Credit Policy
This sounds simple, but this edict often falls to the way side. The credit policy isn’t just for customers, it is for your internal staff too. A clear credit policy improves customer service by setting clear expectations for sales staff. In turn the sales staff provides clearer expectations to customers. Customer service, billing, credit, and collections staff benefit from knowing the boundaries too. It promotes consistent messaging for customers. If the credit policy is too tight or rigid, then the stakeholders can agree on changes. As changes are made, you are able to measure the impact. A clear credit policy helps manage delinquency. Senior management must be involved in setting the tone for your company. The credit policy is a compilation of expectations for customers and internal departments and the entire company must get behind it and support it.
Reign in Accounts Receivable Exceptions
You can’t eliminate every exception. Credit and accounts receivable management requires flexibility and judgment calls. If your salespeople constantly require exceptions for needy customers, it is often a sign that those customers aren’t as good as the sales people purport them to be. Exceptions don’t just lie within the selling process.
- Does your company have departments that are backlogged which causes a negative impact on your aging?
- Is billing slow to issue credits?
- Is cash posting behind and/or unorganized?
- Does your collection staff cater to customers asking for long term payments?
These issues dilute your efforts to improve cash flow. Prevent dilution by stepping back and looking at the problems from a distance.
Can you clarify your policy to eliminate the sales exceptions?
Can you work with your management team to eliminate log jams and improve procedures? The company may think these are “internal” issues; however, I have found that correcting these problems improves your customer’s experience. Their experience is not limited to buying a product, they continue to “experience” your company through the time they remit payment. If your back office requires improvement, chances are your customers know this too and all the window dressing to make their sales experience exceptional can be eroded quickly during the invoice to cash process.
Decisiveness Impacts Accounts Receivable
A weak credit policy makes for weak decisions. Customers are likely to expect exceptions if your sales and collections staff are undermining policy by offering exceptions at every turn. A decisive credit policy sets clear expectations about what is/isn’t acceptable; from establishing the size of credit lines and the documentation required to complete a sale, to escalating collection action on accounts that fall delinquent. Customers that know you will escalate their accounts to collections will pay you faster. Avoid indecisiveness, a weak credit policy attracts the bottom feeders in just about any industry. When that happens, customers that are under-funded make up a greater share of your aging making it more challenging to control delinquency.
Educate & Communicate
As you fine tune and adjust your credit policy, share the changes with all the stakeholders, i.e. management, sales, operations, credit/collections, and customers. Revisit the basic tenants of the credit policy frequently to ensure everyone is on the same page. When you do, you will find a “one company” approach makes it easy to reduce exceptions and manage delinquency proactively.
How many more sales must you generate to offset bad debt? With the recent pullback in the stock market, it reminds us that the economic winds are ever-changing. You may think twice about your credit policy if your sales team is chasing poor credit risks in a volatile economic environment. We wanted to provide you information and a helpful tool to quantify the impact of bad debt and the sales volume necessary to offset it.
The Real Cost of Bad Debt
We all know that bad debt is detrimental, but more importantly, bad debt goes beyond the obvious line item on your income statement. There are additional negative consequences resulting from high levels of bad debt. You lose cash flow, you have reduced profits, you lose people’s time in pursuing the sale, and you lose time and expense attempting to collect the debt. If your company’s funding is tied to an asset based loan, your lending costs and restrictions on your borrowing base can be crippling. The impact of a bad credit decisions is exponentially bad for your bottom line. The bad debt line item on your financials is just the negative number you see. Can you imagine what it would be if you included all those additional costs?
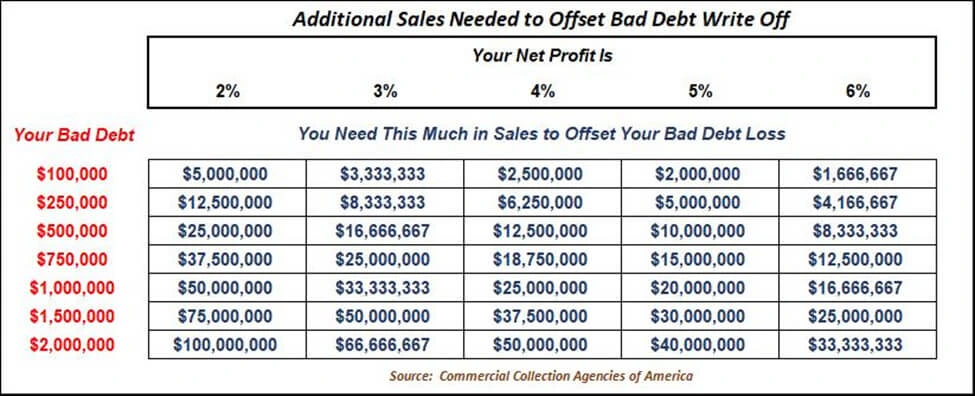
Solutions to Minimize Losses
IT’S NOT ENOUGH TO “SELL” MORE TO OFFSET LOSSES, THOUGHTFUL CREDIT AND COLLECTIONS POLICIES HELP YOU MANAGE RISKS AND REDUCE WRITE OFFS:
- Management sets credit review levels in order to see problems in their infancy. Seeing accounts early allows you to work with customers and resolve problems before those problems get out of hand.
- Many clients have routine meetings with finance, credit and collections, and sales. The purpose is to discuss problem accounts and develop effective strategies to recover money. it allows you to achieve a buy in from all stakeholders.
- Employ regimented in-house collection programs based on balance size. Contact customers in priority order (largest to smallest) to minimize bad debt. If customers don’t pay, their balance is escalated to the next step.
Examining the Components and Ratios of an Income Statement To Show Business Health
The Income Statement – also referred to as the operating statement, profit and loss statement (P&L), earnings statement, or statement of operations – provides a summary of a company’s profit or loss during a specific time period. Together with the Balance Sheet, which provides information at a specific point in time, it is an important tool for vendors in determining the health of an organization.
Components of the Income Statement: What They Tell Us
- SALES OR REVENUES (“NET SALES” ON THE SAMPLE): Often called the “top line,” it represents the amount the company sold during the period.
- COST OF GOODS SOLD: The amount it costs to make or procure the products or services an organization sells. For manufacturing firms, this includes the direct cost of raw materials, labor, and manufacturing overhead to make the product. For wholesalers and retailers, it is the purchase cost of the merchandise sold. For service companies, it’s the direct costs involved in providing the service.
- GROSS MARGIN (“GROSS PROFIT” ON THE SAMPLE): May also could be “Gross Loss”, this represents Net Sales – (minus) Cost of Goods Sold. It’s important to look at this number over time, as a trend. If there is an increase in sales, with a drop in the gross margin to sales ratio, it’s an indication the company is growing weak on the top line and may be in jeopardy.
- SELLING, GENERAL, AND ADMINISTRATIVE EXPENSES (SG&A): Often called “overhead” or “fixed costs”, these represent the organization’s operational expenses not directly related to making or procuring their products/services. For instance: salaries, commissions, marketing costs, utilities, insurance, office supplies, etc. The goal is to keep these expenses as low as possible. The trend of these expenses as a percentage of sales should be watched closely to detect signs of managerial inefficiency.
- OPERATING INCOME: Represents gross profits – (minus) SG&A. The company’s earnings from its normal operations, before interest, non-operating income and costs, taxes, etc. Operating income is viewed by some analysts as more reliable than net income as a measure of profitability.
- INTEREST EXPENSE: The costs of the company’s credit lines and other borrowings.
- OTHER (INCOME) EXPENSE: Items not related to the primary business activities of the company, for instance income from subletting space, patents, unusual or infrequent gains and losses.
- INCOME BEFORE INCOME TAXES OR PRETAX INCOME: This is exactly what the name describes. As there are many ways to avoid or decrease income tax expense, some analysts consider this pretax income as an accurate measure of the company’s profitability.
- PROVISION FOR INCOME TAXES: What the organization expects to have to pay in income taxes for the period.
- NET INCOME: Called the “bottom line” – because it actually is the last line of the statement. This is the profit (or loss) for the period covered by the Income Statement. Obviously, you want to see a positive number here; the higher, the better.
Sample Income Statement: Acme Manufacturing
While a credit decision should never be made looking at one financial statement alone, Acme Manufacturing’s Income Statement (seen below) can be assessed through a variety of ratios and formulas to general show business health.
| Gross Sales | $1,909,200 | |
| Sales Returns and Allowances | $18,000 | |
| Sales Discounts | $27,200 | ($45,200) |
| Net Sales | $1,864,000 | |
| Cost of Goods Sold | ($1,262,500) | |
| Gross Profit | $601,500 | |
| Expenses | ||
| Selling | $261,700 | |
| Administrative | $85,000 | ($346,700) |
| Income Before Interest Items and Taxes $254,800 | ||
| Interest Revenue | $3,400 | |
| $254,800 | ||
| Interest Expense | ($26,500) | |
| Net Income Before Income Taxes | $231,700 | |
| Income Tax Expenses | ($93,600) | |
| NET INCOME AFTER TAXES | $138,100 | |
| * Depreciation – Building ($33,000) and Equipment ($22,200) – are included in manufacturing overhead as apart of Cost of Goods Sold | ||
Using the Income Statement to Determine the Financial Health of a Business
Ratio analysis is the primary means of determining the overall financial condition of a potential customer. Ratios are even more valuable when you apply them to multiple years of a company’s income statements to establish a trend, or obtain industry average ratios with which to compare results. There are many ratios, and formulas for those ratios, used in financial analysis. We cover just a few of them below.
INCOME STATEMENT RATIOS
These ratios utilize figures from the Income Statement alone.
Gross Margin Ratio: Gross Profit ÷ Net Sales. This measures the percentage of sales dollars available to pay the overhead expenses of the company.
A related ratio is the Net Profit Margin Ratio: Net Income Before Income Taxes ÷ Net Sales. Both ratios determine the percentage of profits for each sales dollar obtained. The higher the ratio, the higher the profit margin.
EXAMPLE #1: ACME MANUFACTURING GROSS MARGIN AND NET PROFIT RATIOS
| 2022 | |
| Gross Margin | $601,500 ÷ $1,864,000 = 32.27% |
| Net Profit Margin | $231,700 ÷ $1,864,000 = 12.43% |
Other Ratios Utilizing Both the Income Statement and Balance Sheet Information
INVENTORY TURNOVER RATIO: Net Sales (Income Statement) ÷ Inventory (Balance Sheet).
“Net Sales” is for the entire period (in this case the year) and “Inventory” represents the inventory balance at the end of the year. The Inventory Turnover ratio measures the efficiency of inventory management. The more times inventory is turned in an operating cycle, the greater the profit.
EXAMPLE #2: ACME MANUFACTURING INVENTORY TURNOVER RATIO
| 2022 | |
| Inventory Turnover | $1,874,000 ÷ 158,600 = 11.82 times |
RETURN ON EQUITY: Net Profit after Taxes (Net Income on Income Statement) ÷ Net Worth (Total Stockholders’ Equity on Balance Sheet). This ratio measures the ability of the company to realize an adequate return on capital invested by the owners. The higher the number, the more efficient management is utilizing this capital.
EXAMPLE #3: ACME MANUFACTURING RETURN ON EQUITY RATIO
| 2022 | |
| Return on Equity | $138,100 ÷ $1,165,200 = 11.85% |
RETURN ON ASSETS: Net Profit after Taxes (Net Income on Income Statement) ÷ Total Assets (Balance Sheet). This ratio indicates how efficiently management is using its assets to generate earnings. An increase in this percentage is a positive sign.
EXAMPLE #4: ACME MANUFACTURING RETURN ON ASSETS RATIO
| 2022 | |
| Return on Assets | $138,100 ÷ $1,724,000 = 8.01% |
ASSETS TO SALES: Total Assets (Balance Sheet) ÷ Net Sales (Income Statement)
This ratio measures the percentage of investment in assets that are required to generate the current annual sales level. A high percentage may indicate that a business is not aggressive in its sales efforts or is not fully utilizing its assets.
EXAMPLE #5: ACME MANUFACTURING ASSETS TO SALES RATIO
| 2022 | |
| Assets to Sales | $1,724,000 ÷ $1,864,000 = 92.49% |
ACCOUNTS PAYABLE TO SALES = Accounts Payable (Balance Sheet) ÷ Net Sales (Income Statement)
This ratio measures how the company pays its suppliers in relation to the sales volume being transacted. A low percentage indicates a healthy ratio. A high percentage may indicate the business is using suppliers to help finance operations.
EXAMPLE #6: ACME MANUFACTURING A/P TO SALES RATIO
| 2022 | |
| A/P to Sales | $100,500 ÷ $1,864,000 = 5.39% |
Conclusion
As you can see, the Income Statement and Balance Sheet are valuable sources of information for the credit manager. Both are available for all U.S. public companies. Unfortunately, they are difficult to obtain from private U.S. firms.
The Cash Flow Statement – also referred to as a statement of cash flows or funds flow statement – is one of the three financial statements commonly used to gauge a company’s performance and overall health. The other two financial statements — Balance Sheet and Income Statement — have been addressed in previous articles.
As the name implies, the Cash Flow Statement provides information about an organization’s cash inflows and outflows over a specified time period. Simply put, it reveals how a company spends its money (cash outflows) and where that money comes from (cash inflows).
Examining the Components and Ratios of a Cash Flow Statement To Show Business Health
This statement is the best resource for testing a company’s liquidity because it shows changes over time, rather than absolute dollar amounts at a specific point in time. It’s also useful in determining the short-term viability of a company.
It’s important to note that the Cash Flow Statement reflects a firm’s liquidity. It does not show profitability – the Income Statement does that.
Cash Flow Statement: Acme Manufacturing
| Cash Flow From Operations | |
| Net Income | $138,100 |
| Additions to Cash | |
| Depreciations | $55,500 |
| Decrease in Accounts Receivable | $13,000 |
| Increase in Accounts Payable | $12,000 |
| Increase in Taxes Payable | $8,000 |
| Subtractions from Cash | |
| Increase in Inventory | ($100,000) |
| Net Cash From Operations | $126,600 |
| Cash Flow From Investing | |
| Equipment | ($73,000) |
| Cash Flow From Financing | |
| Notes Payable | $10,025 |
| CASH FLOW FOR FY ENDED 31 DEC 2020 | $63,625 |
How the Cash Flow Statement is Prepared
There are two methods of preparing the Cash Flow Statement: direct and indirect.
- The direct method utilizes actual cash flow information from the company’s operations. It presents major classes of gross cash receipts and payments. The direct method would most likely be used by small firms doing their accounting on a cash rather than an accrual basis.
- The indirect method derives the data from the Income Statement and from changes on the Balance Sheet from one period to the next. Both the Income Statement and the Balance Sheet are based on accrual accounting.
Note #1: Net Income on the Acme Manufacturing’s 2020 Consolidated Statement of Cash Flows is $138,100. This number was taken from Net Income as listed on the Acme Manufacturing 2020 Consolidated Statements of Income.
The U.S. GAAP (Generally Accepted Accounting Principles) requires that a Cash Flow Statement prepared by the indirect method be included in financial statements, even if it is also prepared by the direct method. Therefore, most companies use the indirect method and the rest of this article refers only to the indirect method using Acme Manufacturing’s 2020 data.
Components of the Cash Flow Statement and What They Tell Us
This statement organizes and reports cash in three categories: operating, investing, and financing.
Operating Activities
This represents the key source of an organization’s cash generation. It’s considered by many to be the most important information on the Cash Flow Statement.
This section of the statement shows how much cash is generated from a company’s core products or services. A strong, positive cash flow from operations (especially over time) is a good sign of a healthy company.
Operating Activities starts with the Net Income number from the Income Statement.
Example #1: Acme Manufacturing’s Net Income numbers on the Income Statement and the Cash Flow Statement are the same.
| 2020 | 2019 | |
| Net Income | $138,100 | $242,400 |
| (Income Statement, line 16) | $138,100 | $242,400 |
If all of a company’s operating revenues and expenses were in cash, then Net Cash Provided by Operating Activities (Cash Flow Statement) would equal Net Income (Income Statement). However, this is rarely the case. Typically, adjusting Net Income on the Cash Flow Statement is based on an increase or decrease in cash calculated from changes on the Balance Sheet from one period to the next.
Example #2: Merchandise Inventories on Acme Manufacturing’s Consolidated Balance Sheet
| 2020 | 2019 | |
| Merchandise Inventories (Balance Sheet) | 158,600 | 58,600 |
| Difference in inventory (2020 over 2019) | 158,600 – 58,600 = 100,000 | 158,600 – 58,600 = 100,000 |
The increase in merchandise inventories in 2020 results in a negative adjustment of the same amount ( $100,000) on the 2020 Acme Manufacturing Consolidated Statement of Cash Flows.
Most of these adjustment items can either result in an increase or decrease in cash from operating activities. Exceptions would be adjustments for depreciation and amortization, which are always an increase to Net Income on the Cash Flow Statement.
Look for consistent levels of cash flow from Operating Activities over time, indicating the company will probably continue to be able to fund its operations.
Investing Activities
This section records changes in equipment, assets, or investments.
Cash changes from investing are generally considered “cash outflows” because cash is used to purchase equipment, buildings, or short-term assets. When a company divests an asset, the transaction is considered a “cash inflow.” A healthy company generally invests continually in plant, equipment, land and other fixed assets.
Financing Activities
Changes in debt, loans or stock options, long-term borrowings, etc. are accounted for under Financing Activities.
When capital is raised, it is considered “cash in”; when dividends are paid or debt is reduced, “cash out”. The Financing Activities section shows how borrowing affects the company’s cash flow.
“Bottom Line”
The bottom line on the statement is the Net Increase (Decrease) in Cash and Cash Equivalents. It’s determined by calculating the total cash inflows and outflows for each of the three sections in the Cash Flow Statement.
The 2020 Net Increase (Decrease) in Cash and Cash Equivalents on the Cash Flow Statement should equal the difference between the 2020 and 2019 Cash and Cash Equivalents figures on the Balance Sheet.
Example #3: Acme Manufacturing 2020 Balance Sheet Net Decrease in Cash and Cash Equivalents
| Statement of Cash Flows | 2020 | 2019 |
| Net Cash (Operating Activities) – Net Cash (Investing Activities) + Net Cash (Financing Activities) | $126,600 (operating) – $73,000 (investing) + $10,025 (financing) | $226,600 (operating) – $83,500 (investing) + $12,025 (financing) |
| Bottom Line | $63,625 | $155,125 |
Supplemental Information
There is a fourth section, titled “Supplemental Information”, which is often included with the primary three sections of the Cash Flow Statement. It reports the exchange of significant items, such as company stock for company bonds, which did not involve cash.
This section also records the amount of income taxes and interest paid. The Acme Manufacturing Consolidated Statement of Cash Flows does not include Supplemental Information.
Using the Cash Flow Statement to Determine the Financial Health of an Organization
The statement shows how a company raised money (cash) and how it spent those funds during a given period. It’s a tool that measures a company’s ability to cover its expenses in the near term.
Generally, a company is considered to be in “good shape” if it consistently brings in more cash than it spends. Cash flow reflects a company’s financial health, and its ability to pay its bills and other liabilities.
In most cases, the more cash available for business operations, the better. However, a low or negative cash flow in one year could result from a company’s growth strategy – and, therefore, not be a real issue. As with all financial analysis, it’s important to determine the company’s cash flow trend.
“High Quality” Net Income
To determine if a company’s net income is of “high quality”, compare the Net Cash Provided by Operating Activities to the Net Income. Both of these figures are found on the Cash Flow Statement. The Net Cash Provided by Operating Activities should be consistently (over time) greater than the Net Income.
Note #3: On Acme Manufacturing’s Consolidated Statement of Cash Flows, you can see that 2020 Net Cash Provided by Operating Activities is less than Net Income. This is not a good sign. It’s important to understand, however, where the decrease is coming from – so a more thorough analysis over a greater period of time would help.
Cash Flow-based Financial Ratios
The problem with using the Balance Sheet for liquidity analysis is that it only presents data that measures where the organization stands at a particular point in time.
The problem with the Income Statement is that it includes many non-cash allocations, accounting conventions, accruals and reserves that have nothing to do with cash.
Utilizing the Cash Flow Statement for liquidity analysis results in a more dynamic picture of the resources a company has to meet its current financial obligations.
1. Cash Flow to Sales = Operating Cash Flow ÷ Net Sales
This ratio determines how much cash is being generated for each dollar of sales. Obviously, the higher the number, the better.
Example #4: Acme Manufacturing Cash Flow to Sales
| Net Cash Provided by Operating Activities (Cash Flow Statement) | Net Sales (Income Statement) | Cash Generated for Each Dollar of Sales | |
| 2020 | $126,600 ÷ | $1,864,000 = | $0.06 or 6% |
| 2019 | $226,600 ÷ | $1,790,200 = | $0.13 or 13% |
Is this good or bad? At first glance, six cents cash generated by each one dollar of sales in 2020 isn’t great, but not bad. What is troubling, however, is that Acme Manufacturing’s Cash Flow to Sales has decreased by seven cents from the previous year, which is a major cause for concern. To make a more accurate assessment, you should compare this performance to industry benchmarks and get to the root of what caused such a decrease.
2. Operation Index = Net Cash from Operations ÷ Net Income after income tax
This measures the relationship between operating cash flows and profit. The higher the percentage, the better.
Example #5: Acme Manufacturing Operation Index
| Net Cash Provided by Operating Activities (Cash Flow Statement) | Net Income (Income Statement) | Operation Index | |
| 2020 | $126,600 | $138,100 | 91.6% |
| 2019 | $226,600 | $242,400 | 93.5% |
3. Operating Cash Flow Ratio = Cash Flow from Operations ÷ Current Liabilities
This ratio is used to assess whether an operation is generating enough cash to cover current liabilities.
If the ratio falls below 1.00, the company isn’t bringing in enough cash and will have to find other sources to finance its operations.
Example #6: Acme Manufacturing Operating Cash Flow (OCF) Ratio
| Net Cash Provided by Operating Activities (Cash Flow Statement) | Total Current Liabilities (Balance Sheet) | Operating Cash Flow Ratio | |
| 2020 | $126,600 | $558,800 | $0.23 |
| 2019 | $226,600 | $560,800 | $0.40 |
Conclusion
Looking at the Balance Sheet and Income Statement in previous articles, Acme Manufacturing has taken on too much inventory in 2020 and is negatively affecting its free cash flow. The overall impression from the Cash Flow Statement raises concern regarding Acme Manufacturing’s ability to pay its short-term liabilities (including payments due creditors).
The Income Statement and Balance Sheet are important tools for evaluating a company’s health. However, the Cash Flow Statement is an important complement to these, and should not be overlooked.
These articles give you a basic understanding and the tools you need. Use them to improve your credit decision-making process by examining all three of these financial statements to get the best idea of how a current or potential customer’s company is doing.
Examining the Components and Ratios of a Balance Sheet To Show Business Health
Assets = Shareholders’ Equity + Liabilities
The equation above represents the primary components of the balance sheet, an integral part of a company’s financial statements.
The balance sheet highlights the financial position of a company at a particular point in time (generally the last day of its fiscal year). This financial statement is so named simply because the two sides of the Balance Sheet (Total Assets and Total Shareholder’s Equity and Liabilities) must balance.
Of the three primary financial statements – Balance Sheet, Income Statement, and Statement of Cash Flows – the Balance Sheet is the only one that provides data at a single point in time, rather than over a defined time period.
Sample Balance Sheet: Acme Manufacturing
Similar to the Income Statement, Acme manufacturing’s Balance sheet (seen below) can be assessed through a variety of ratios and functions. While credit decisions should not be based on the analysis of a balance sheet or income statement alone, it does offer insight to show general business health.
| ASSETS |
| Current |
| Cash | – | $160,000 | – | ||
| Accounts Receivable | $221,400 | – | – | ||
| (less bad debt allowance) | $14,400 | $207,000 | – | ||
| Marketable Securities | – | $37,500 | – | ||
| Inventory | – | $158,600 | – | ||
| Prepaid Insurance | – | $9,400 | $572,500 | ||
| Long Term (plant, property, equipment) |
| Land | – | $114,500 | – | ||
| Buildings | $790,200 | – | – | ||
| – Depreciation | $192,000 | $598,200 | – | ||
| Equipment | $643,800 | – | – | ||
| TOTAL ASSETS | $1,724,000 | ||||
| LIABILITIES |
| Current |
| Accounts Payable | $100,500 | – | – | |
| Accrued Wages Payable | $86,800 | – | – | |
| Income Taxes Payable | $93,500 | $280,800 | – | |
| Long Term | – | – | – | |
| Mortgage Payable | – | $278,000 | $558,800 | |
| Equity |
| Common Stock | – | – | – | |
| 22,000 Shares Outstanding | $220,000 | – | – | |
| Retained Earnings | $945,200 | – | $1,165,200 | |
| TOTAL LIABILITIES AND EQUITY | $1,724,000 | |||
Components of the Balance Sheet and What They Can Tell Us
By looking at the Balance Sheet equation, you can determine how the company has financed its assets. They have two options: by borrowing (liabilities) and by using the shareholders’ investment (equity). While most going concerns (businesses that will meet financial obligations when due) will have liabilities on their account, a high percentage of liabilities compared to assets or equity can be cause for concern.
Example #1 – Acme Manufacturing’s 2020 Assets
| 2020 | |
| Assets = Shareholders’ Equity + Liabilities | $1,165,200 (Shareholders’ Equity) + $558,800 (Liabilities) = $1,724,000 |
As you can see, Acme Manufacturing’s 2020 assets are not financed equally. Shareholder’s Equity represents 67.6% of their assets while Liabilities represent 32.4% of their assets. This is one sign of a generally healthy business.
Assets
Assets represent the resources that a business owns or controls at a given point in time. There are two main types of assets:
Current Assets
- Cash
- Cash Equivalents: Assets/investments that are “liquid” (easily converted into cash), including money market holdings, short-term government bonds or Treasury bills, marketable securities, etc. These are current assets if they mature within 3 months and have no significant risk of a change in value. Common stock, therefore, cannot be considered a cash equivalent, but preferred stock, acquired shortly before its redemption date, can be.
- Inventory
- Accounts (Trade) Receivables: These are classified as a current asset if they are due within one year or less.
- Prepaid Expenses: Money paid for future services that will be used within a year.
When a large amount of cash is recorded on the balance sheet, it’s generally a good sign as it offers protection during business slow-downs and provides options for future growth.
Growing cash reserves often signal strong company performance; dwindling cash can indicate potential difficulties in paying its debt (liabilities). However, if large cash figures are typical of a company’s balance sheet over time, it could be a red flag that management is too shortsighted to know what to do with the money.
Note #1: You can see that Acme Manufacturing’s current assets are primarily Accounts Receivable and Inventory ($207,000 + $158,000 = 21.2% of current assets) rather than Cash & Cash Equivalents ($160,000 + $37,500 = 11.5% of current assets).
Fixed Assets
Also known as “non-current assets”, “capital assets”, “long-term assets” or “property, plant and equipment” (PP&E). Fixed assets are not quickly or easily converted into cash. These include:
- Land
- Buildings
- Vehicles
- Furniture
- Equipment
- Fixtures
Liabilities
Liabilities represent what the company owes. The two primary types of liabilities are:
- Current Liabilities: Obligations the company must pay within a year, including accounts payable, notes payable, accrued expenses, current maturities on long-term debt liabilities.
- Long-term Liabilities: Obligations not due within one year, including things like mortgages, bonds, long-term notes payable.
Financially healthy companies generally have a manageable amount of debt (liabilities and equity). If the debt level has been falling over time, that’s a good sign. If the business has more assets than liabilities – also a good sign. However, if liabilities are more than assets, you need to look more closely at the company’s ability to pay its debt obligations.
Note #2: Total Liabilities listed for Acme Manufacturing is almost evenly split, with current liabilities representing 50.3% and long term liabilities representing 49.7%.
Equity
Equity, often called “shareholders equity”, “stockholder’s equity”, or “net worth”, represents what the owners/shareholders own.
Equity is considered a type of liability, as it represents funds owed by the business to the shareholders/owners. On the balance sheet, Equity = Total Assets – Total Liabilities.
The two most important equity items are:
- Paid-in capital: the dollar amount shareholders/owners paid when the stock was first offered.
- Retained earnings: the money (profit) the firm has elected to reinvest in the company.
Using Balance Sheet Data to Determine the Financial Health of a Business
Balance Sheet Ratios: The primary ratios utilizing numbers from the Balance Sheet fall into two broad categories: (1) financial strength ratios, and (2) activity ratios.
Financial Strength Ratios: These ratios provide information on how well the company can meet its obligations, how financially stable it is, and how it finances itself.
Current Ratio: Current Assets ÷ Current Liabilities
This ratio measures a firm’s liquidity – whether it has enough resources (current assets) to pay its current liabilities. It calculates how many dollars in current assets are available for each dollar in short-term debt.
A current ratio of 2.00, meaning there are $2.00 in current assets available for each $1.00 of short-term debt, is generally considered acceptable. The greater the ratio, the better.
A current ratio that is less than the industry average can indicate a liquidity issue (not enough current assets). If the current ratio is greater than the industry average, it may suggest that the firm is not using its funds efficiently.
Example #2 – Acme Manufacturing’s Current Ratio
| 2020 | |
| Current Assets = Current Assets ÷ Current Liabilities | $572,500 (Current Assets) ÷ $280,800 (Current Liabilities) = $2.04 |
As you can see, Acme Manufacturing’s liquidity shows over $2.00 available in current assets for every dollar of short term debt – this is acceptable.
Working Capital: Current Assets – Current Liabilities
Working Capital represents operating liquidity.
The Working Capital ratio is similar to the Current Ratio but looks at the actual number of dollars available to pay off current liabilities. Like the current ratio, it provides an indication of the company’s ability to meet its current debt. The higher the result, the better. A negative result would indicate that the company does not have enough assets to pay short-term debt.
Example #3 – Acme Manufacturing’s Working Capital (WC)
| 2020 | |
| Working Capital (WC) = Current Assets – Current Liabilities | $572,500 (Current Assets) – $280, 800 (Current Liabilities) = $291,700 |
Acme Manufacturing’s Working capital is positive, representing a larger dollar value than their current liabilities.
Quick Ratio: (Current Assets – Inventories) ÷ Current Liabilities
Similar to the Current Ratio, the Quick Ratio provides a more conservative view as Inventories (generally part of Current Assets) are excluded in the calculation under the assumption that inventory cannot be turned into cash quickly. If the ratio is 1 or higher, the company has enough cash and liquid assets to cover its short-term debt obligations.
Example #4 – Acme Manufacturing’s Quick Ratio
| 2020 | |
| Quick Ratio = (Current Assets – Inventories) ÷ Current Liabilities | ($572,500 (Current Assets) – $158,600 (Inventories)) ÷ $280,800 (Current Liabilities) = $1.47 |
With a more conservative view at Acme Manufacturing’s operating liquidity, there is definitely enough cash and liquid assets to cover short term debts.
Debt to Equity (Leverage) Ratio: Total Liabilities ÷ Total Equity
Also called the “Acid Test”, the Debt to Equity ratio measures the ability of the company to use its current assets to retire current liabilities. It provides an indication of how the firm finances its assets. A high result indicates that a company is financing a large percentage of its assets with debt, not a good thing.
The upper acceptable limit is 2.00 with no more than 1/3 of debt in long-term liabilities. The lower the ratio, the better.
Example #5 – Acme Manufacturing’s Debt to Equity Ratio
| 2020 | |
| Debt to Equity (Leverage) Ratio = Total Liabilities ÷ Total Equity | $558,800 (Total Liabilities) ÷ $1,165,200 (Total Equity) = $0.48 |
Acme Manufacturing shows a very good Debt to Equity ratio.
Other Assets and Liabilities
There are certain classes of assets and debt that are usually not included on a small or medium-sized company’s balance sheet because they are not available for payment of a firm’s debt. These include:
Intangible Assets: Sometimes called Intellectual Property, including goodwill, patents, copyrights, mailing lists, catalogs, trademarks, organization expense.
Long-Term Investments: Including investment in, or advances to subsidiaries, cash surrender value of insurance policies, cash or securities set aside in “special funds”, investment in stocks or bonds for possible capital appreciation.
Miscellaneous Assets: Including receivables from officers or employees and advances to sales people.
Off-balance sheet debt: A form of financing in which large capital expenditures are kept off the balance sheet.
The Balance Sheet is an important source of information for the credit manager. It is universally available for all U.S. public corporations, but may be difficult to obtain from private firms.
The numbers have little value, however, unless they are compared to:
- An industry benchmark, and/or
- Balance sheets for the same company in previous years, so you can determine if there is a trend in one direction or another.
In the case of our sample Acme Manufacturing’s Balance Sheet, it appears that their financial health is in good standing. However, it would make sense to obtain the previous year’s Balance Sheet to compare any trends that should be addressed in the next fiscal year. It would also be helpful to read the Notes to Consolidated Financial Statements included in the 10-Ks supplied to the U.S. Securities and Exchange Commission.
Most sellers are very familiar with Open Account (O/A) and Letter of Credit (L/C) transactions. In the international arena, open account sales are regarded as having the most risk; letter of credit transactions as having the least.
Lower Your Risk With These Lesser Known Terms of Payment
Between these two poles, however, are two lesser-known transaction types: Documents Against Payment (D/P) and Documents Against Acceptance (D/A). These represent risk levels lower than an O/A, but greater than an L/C. Both rely on an instrument widely used in international trade called a bill of exchange or draft.
Bill of Exchange / Draft
A bill of exchange, or draft, is a negotiable instrument that is both drawn up by and made payable to the exporter/seller. Although written by the seller, it has the equivalent effect of a check written by the buyer.
It is generally a three-party instrument consisting of a:
- Drawer: The party issuing the bill of exchange; usually the exporter/seller.
- Drawee: The recipient of the bill of exchange for payment or acceptance; usually the buyer.
- Payee: The party to whom the bill is payable; usually the seller’s bank.
Bills of exchange are either payable at sight (sight drafts) where the bank pays the full amount upon presentation, or payable at some future date (time or term drafts).
D/P – Documents Against Payment
The D/P transaction utilizes a sight draft, where payment is on demand.
After the goods are shipped, the exporter sends the sight draft to the clearing bank, along with documents necessary for the importer/buyer to obtain the goods from customs. The buyer has to settle the payment with the bank before the documents are released and he can take delivery of the goods. If the buyer fails or refuses to pay, the exporter has the right to recover the goods and resell them.
On the surface, D/P transactions seem fairly safe from the seller’s perspective. However, in practice, there are risks involved:
- The buyer can refuse to honor payment on any grounds.
- When the goods are shipped long distances, say from Hong Kong to the United States, it is usually impractical and too expensive for the seller to pay for return transportation. Thus, the seller is forced to sell the goods in the original country of destination at what is usually a heavy discount.
- Unlike letters of credit, the exporter’s bank does not assume liability to pay if the importer dishonors the Bill of Exchange.
- In cases of shipments by air freight, it is possible that the buyer will actually receive the goods before going to the bank and paying for them.
D/A – Documents Against Acceptance
The D/A transaction utilizes a term or time draft. In this case, the documents required to take possession of the goods are released by the clearing bank only after the buyer accepts a time draft drawn upon him. In essence, this is a deferred payment or credit arrangement. The buyer’s assent is referred to as a trade acceptance.
D/A terms are usually after sight, for instance “at 90 days sight”, or after a specific date, such as “at 150 days bill of lading date.”
As with open account terms, there are some inherent risks in selling on D/A:
- As with a D/P, the importer can refuse to accept the goods for any reason, even if they are in good condition.
- There is a slight risk that the importer will receive their goods without the original shipping documents (such as a bill of landing, commercial invoice, or certificate of origin).
- The buyer can default on the payment of a trade acceptance. Unless it has been guaranteed by the clearing bank, the seller will need to institute collection procedures and/or legal action.
Avalisation of the Bills of Exchange
In certain cases, exporters may seek out a third party—typically a bank—to guarantee payment of a bill of exchange drawn on the importer. The process of a third party endorsing the back of a bill of exchange is called Avalisation, and can be utilized at the exporter’s request in situations where risk is high. In doing so, the exporter has shifted potential risk onto the bank if an importer does not accept or does not pay a bill of exchange.
Discounting a Bill of Exchange
If the drawer of a bill does not want to wait for the drawee to send funds, the drawer can sell the Bill of Exchange to a bank at a discounted rate. This should only be considered when the risk involved in D/P or D/A transactions still proves financially burdensome after considering avalizing the bill. The process for discounting is as follows:
- The bill first must be endorsed by the drawer with a signed and dated order to pay the bank.
- The bank then becomes the holder (owner) of the bill.
- Once ownership transfers, the bank pays the original drawer of the bill an agreed upon rate.
- Payment is equal to face value of the bill unless interest accrues. (Face value = amount issuer provides bond holder when bill reaches maturity)
Advantages for the Seller in D/P and D/A Transactions
Despite the risks listed above, utilizing D/P and D/A transactions have a number of advantages for the seller:
- The bill of exchange facilitates the granting of trade credit to a buyer.
- It can provide the seller access to financing.
- The bill of exchange is formal, documentary evidence, acceptable in most courts, confirming that the demand for payment (or acceptance) has been made to the buyer.
- The seller retains control over the goods until the buyer either pays draft on sight (D/P) or as a legal time & terms draft (D/A).
- Bills of exchange can be bought and sold at a reduced rate through discounting.
Recourse for Dishonored Bills of Exchange
It is possible for the seller to dispute an unpaid/unaccepted (called dishonored) bill of exchange, sue the buyer, and potentially receive payment. Dishonor occurs when the drawee fails to pay on date of maturity or fails to accept the bill of exchange. The seller disputes a dishonored bill of exchange via a formal, usually two-step, process.
Step #1 Noting: A bill of exchange is noted in order to obtain official evidence that it has been dishonored. A Notary Public presents the bill/draft to the drawee (buyer) for acceptance or payment and notes on the bill the reason given for dishonor. Noting is often followed by a formal protest.
Step #2 Protesting: The Notary Public produces a formal deed of protest bearing his seal. This document provides formal evidence of the presentation of the bill to the drawee and the reason for the dishonor. The protest is accepted by most courts in the world as prima facie evidence that the bill has been dishonored.
Should the buyer fraudulently obtain possession of the documents, or the goods, without paying or accepting the bill of exchange, it is possible to seek satisfaction from the clearing bank or the customs warehouse.
Conclusion
When documented fully and correctly, D/A and D/P transactions provide a means for exporters to extend some level of credit facilities to their customers, while at the same time protecting their legal rights to payment. For many international export agencies, it is the perfect median between expensive, time consuming letters of credit and the high-risks involved with handling open accounts.
Addendum: Rules Governing Bills of Exchange
Most countries have adopted codified laws on Bills of Exchange following, in general, those set forth in the League of Nations’ Geneva Conventions (1930).
The United Kingdom Bills of Exchange Act 1882 is the basis for rules governing Bills of Exchange in Ireland, U.K. and Commonwealth countries that were part of the British Empire.
In the United States, Article 3 of the Uniform Commercial Code governs the issuance, transfer and enforcement of negotiable instruments including bills of exchange.
The United Nations Commission on International Trade Law (UNCITRAL) has designed a Convention to harmonize the various country laws. This Convention, called the United Nations Convention on International Bills of Exchange and International Promissory Notes, was adopted and opened for signature by the UN General Assembly in 1988. It has not yet received the 10 signatures required for ratification. This Convention only applies if the parties use a particular form of a negotiable instrument indicating that the instrument is subject to the UNCITRAL Convention